Please contact us with any other questions you might have.
Training - GC injection
Benefits of SGE inlet liner deactivation
- Deactivation is carried out at a temperature >400°C, which is hotter than injection port temperatures. This ensures no thermal breakdown of the deactivation under normal injection operating conditions.
- in situ deactivation of all liners with quartz wool means there is no handling of the wool after deactivation. Manual handling of wool can cause fracturing which can lead to active sites.
- Proprietary deactivation reagent ensures stability of deactivation and excellent lifetime.

Comparison using a non-deactivated inlet liner, and a deactivated inlet liner

General rules on activity
Less residence time means better recoveries! Why? Less time means less reactions. Avoid keeping the sample in the injection port for longer than you need to. High inlet flows and split ratios keep contact with the injection port to a minimum.
Inlet liner deactivation effect on activity

Activity - Split vs Splitless
These chromatograms show the difference between split and splitless injection mode when using a liner that contains quartz wool. In split mode the sample does not stay in the liner for long, so the breakdown is minimal. The biggest difference between the two chromatograms is the response of endrin.

The goal of sample introduction
To get your sample into the column as fast as possible in a reproducible manner, without chemical change.
Effect of injection speed
Slow injection may result in broad and split peaks on the chromatogram.

What is mass discrimination?
Mass discrimination is defined as an unrepresentative sampling from the injector to the column of low and high molecular weight components.
Mass discrimination - Inlet temperature
The top chromatogram shows you what happens when the injection port temperature is too low. C22 has not gained enough energy to vaporize during the 1 minute splitless time. Most of the other hydrocarbons are unaffected by the temperature difference, in fact, the areas are the same for C8 to C16 in both chromatograms. But it is clear that 200°C gives much better recoveries for the heavier compounds than 120°C.

Split injection introduction
The ideal scenario when you inject your sample into the liner in split mode is to get rapid volatilization and homogeneous mixing with the carrier gas.
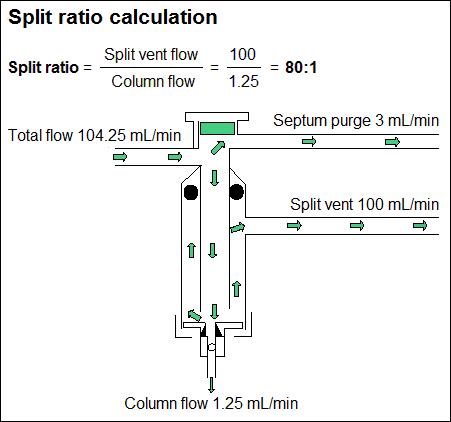
In split injection mode, most of the sample will pass out the split vent to atmosphere and only a small proportion will flow into the column. This is usually about 1%. At the bottom of the injection port a small part of this mixture will transfer to the column, while the bulk of the mixture will leave the inlet via the split vent. To get a consistent split ratio, the sample (solvent + solute) must be mixed with the carrier gas to give a homogeneous mixture.

Split ratio calculation
Split ratio = Split vent flow / Column flow
Split ratio linearity
The split ratio only has a linear effect on sample concentration between 200:1 and 25:1.
Reducing the split ratio lower than 25:1 will not give a linear increase in sample concentration. Going from 20:1 to 10:1 will not double the amount of sample on column. At low split ratios, there can be an increase in peak broadening especially of early eluting peaks (maybe also column overload).
High split ratios above 200:1 can give mass discrimination (also wastage of carrier gas). Fast GC can have splits up to 1000:1. Since flow of column is lower the amount of carrier put to atmosphere is much lower also.

- Split flows must be high enough to ensure a narrow sample band. If the split flow is too low (e.g. 10 mL/min), the peaks will become very broad because it takes too long for the sample to exit the liner.
- Must be low enough to maintain sensitivity. If the split flow is too high, most of the sample will be vented to the atmosphere instead of entering the column. This can be useful when injecting concentrated samples, but small peaks in dilute samples could disappear altogether.
- Typical split flows are between 25 and 200 mL/min.

Effect of split flow
These two chromatograms emphasize the importance of adequate split flow. In the top chromatogram, the split ratio is 50:1 but the analysis has been carried out on a 0.1 mm ID column. The flow through this column at 33.2 psi is only 0.22 mL/min (27 cm/sec). This would appear to be optimum conditions but the split flow is only 10.5 mL/min. Oven temp is isothermal at 150°C.
The second chromatogram shows analysis using the same conditions but the split flow has been increased to 50 mL/min (split ratio 250:1). Notice the dramatic improvement in the chromatography.

Splitless injection introduction
In splitless mode the split vent is closed during the first part of the injection. This means that the sample can only go down the column. This leads to much higher detection limits because most of the sample will go down the column instead of out the split vent.
Splitless is used for low concentration samples. One thing to remember about splitless is that the gas flow through the liner is equal to the column flow. So the flow through the liner could be as low as 0.5 mL/ min. This means you have to wait longer to flush the sample into the column before you start the temperature program. In fact, the sample will take up to ten minutes to totally exit the liner. For this reason the split vent is always turned back on after 1 minute to quickly remove any residue left in the liner.

Mass discrimination - Splitless time comparison
Comparing the effect of purge time on mass discrimination (unrepresentative sampling from the injector to the column of low and high molecular weight components).
The top chromatogram is an example of what happens when the purge time is too short. As can be seen, C22 has not had enough time to vaporize completely. The sample has spent a little over 10 seconds in the injection port and has not gained enough energy from the liner to completely vaporize the hydrocarbons. There is much high boiling point discrimination.
The bottom chromatogram shows the same sample under the same conditions, except the purge flow turns on one minute after the start of the run.
The first thing you will notice between the two chromatograms is the difference in response of the heavier compounds. The high boilers have now been able to absorb enough energy from the liner to vaporize completely. Another major difference is the increase in height and area of all the compounds in the chromatogram. The peaks in the second chromatogram are almost twice the height than the peaks in the first chromatogram.

Splitless injection purge time
This graph shows the different vaporization rates of hydrocarbons during a splitless injection. The volatile hydrocarbons vaporize rapidly compared to the semi-volatile ones.
At 0.25 min (15 seconds) the volatile and semi-volatile components of the sample have almost finished vaporizing. But the non-volatile C36 and C42 have yet to reach half their final peak area. At this point there is the most discrimination between the hydrocarbons in the sample. From 1/4 of a minute to one minute the areas of C8 to C30 don’t change much but C36 and C42 gain enough energy to more than double their area.
A purge on time of one minute is usually sufficient to get good recoveries for C8 to C36.

Splitless solvent effect
Solvent focusing involves injection of the sample solvent at an oven temperature at least 10-20°C below the boiling point of the solvent. In this way, the solvent completely condenses on the front of the capillary column.
For splitless injection, for a splitless time of 1 minute and 1 mL liner volume, the initial peak width will be approximately one minute wide. Solvent focusing occurs by evaporation first of the solvent at the injector end of the column and the analytes become more and more concentrated in the ever decreasing solvent band as the oven heats up. The analytes will have a greater affinity for the solvent than for the gas phase. Eventually all solvent will evaporate and at this stage, the analytes will have been focused as a narrow band on the column.

What is backflash/flashback?
Backflash will occur when on vaporization, the volume of the expanded gas sample expands to a greater volume than that of the inlet liner.
The result of flashback is that solvent and sample can flow back into the inlet and purge gas lines causing contamination of your system. A really bad case can result in the need to rip out the plumbing and replace the inlet lines - maybe a hair dryer or a hot air gun could help. This effect is much more prevalent in splitless mode.
At 250° C and 10 psi inlet pressure, the following substances will expand:
- 1.0 µL methylene chloride will expand to 0.39 mL
- 1.0 µL water will expand to 1.41 mL
A large injection of a solvent with a large expansion volume can cause an overload in the inlet liner.

Effects of backflash
- Ghost peaks
- Tailing
- Erratic quantitation
- Loss of sensitivity
- Loss of volatiles
Backflash injections and preventative measures
- Choose a solvent with a high molar mass
- Increase the capacity of your inlet liner
- Know the expansion volume
- Lower inlet temperature
- Increase inlet pressure

Effect of solvent type
Not all solvents will expand to the same volume under a set of conditions. The volume of the expanded gas from a liquid of known volume and density can be calculated from the ideal gas law. It is important to remember that the volume gas will increase as the molar mass decreases. This is one of the reasons why water is a very difficult solvent. Water will expand to three - four times the volume compared with methylene chloride.
In this example, if the volume of the liner is less than 0.90 mL, backflash will occur.
Methylene chloride at 250°C and 10 psi inlet pressure, using an inlet liner with capacity less than 0.90 mL:1 μL liquid will expand to 0.40 mL (no backflash)
3 μL liquid will expand to 1.20 mL(causing backflash)
What do we mean by this? Backflash occurs when the volume of the liner is not sufficient to handle the expanded gas volume.
Contamination and ghost peaks from backflash
Backflash can cause severe problems especially in quantitation. If semivolatile solutes enter the inlet lines, this can cause ongoing system contamination in the form of ghost peaks.

Flushing out contamination
Backflash can also be used to your advantage. If the injection system has become contaminated, water can be injected into the liner at high temperature deliberately to cause backflash and flush out contamination through steam distillation. It is recommended to have a length of fused silica tubing connected to the injector rather than a capillary column for this procedure.
Effect of increasing sample volume
In splitless mode, increasing the volume of the injection increases the amount of sample on the column. But the increase is not linear. If you double the injection volume you will not double the amount of sample on column. The main reason why this happens is the liner cannot hold the entire volume of vaporized sample.
Remember, the liner does not have a lid. So injecting more sample will just make more sample flow out the top of the liner. This always happens even with small injection volumes, but the loss of sample becomes exaggerated when large volumes are used.

Inlet liner volume calculation
Volume = Length x πr2
Subtract approximate amount for glass wool or tapers
Agilent Liner = 78.5 mm x 4.0 mm (ID)
not
6.3 mm OD
Volume= 7.85 cm x π x 0.2 cm2
Volume = 0.986 cc or 986 µL
Bruker/Varian Liner = 72 mm x 4.0 mm (ID)
not
6.3 mm OD
Volume = 7.2 cm x π x 0.2 cm2
Volume = 0.905 cc or 905 µL
Question not answered above?